Jump To:
Transportation
Transportation contributes more than half of total community greenhouse gas (GHG) emissions in Raleigh. Because Raleigh has grown more around roads and driving rather than transit and walking, a high percentage of trips are made in cars. This means we can reduce GHG emissions by making other ways of getting around more accessible and reliable. Transportation choices are also closely related to land use decisions. If people live close to places to work, shop, or go to school, they are much more likely to walk and use transit. Read more about transportation and climate change as well as the effect of land use regulations on transportation emissions.
Electric vehicles (EVs) are another high impact strategy for reducing GHG emissions. Not every trip in Raleigh is feasible without a vehicle. For those trips, clean technology like EVs produce far less GHG emissions than traditional gas or diesel vehicles.
To learn more about the Raleigh’s progress towards climate action, please visit our larger City of Raleigh CCAP Data Dashboard. To learn more about climate action across Raleigh, check out the 2024 CCAP Implementation Report.
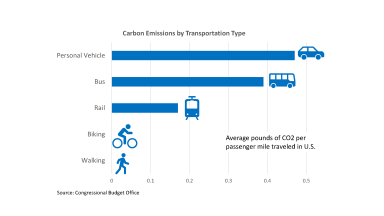
Data from the Congressional Budget Office shows the average emissions per passenger, per mile, for different methods of transportation.
How We Get Around
There are many ways to get around in Raleigh, including walking, biking, transit or driving. Our choices about which way to travel directly relate to our GHG emission impact. Walking and biking trips produce the least GHG emissions. GoRaleigh's transit fleet has a mix of electric and low-emission renewable natural gas vehicles, creating far fewer per-passenger emissions than driving alone.
This visual below shows how people get to work in Raleigh, sourced from the American Community Survey. You can use the box filters at the bottom of the visual to select or unselect specific transportation types.
- More than 60% of Raleigh residents drive alone to work
- About 25% of residents now work from home, a significant increase since the onset of the pandemic, although that number dropped in 2022.
- Carpooling has seen a reduction in the past decade.
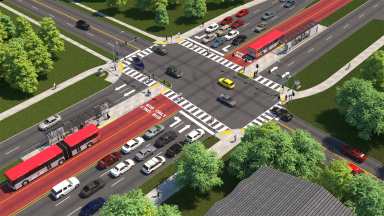
The data does not show significant growth to driving alternatives. However, many City of Raleigh projects are making it easier for the community to get around without a car. Examples include bus rapid transit, sidewalk and bike improvements. Updates to land use plans also allow more people to live and work in walkable places served by transit.
Interested in learning more about transportation alternatives? Please see our 2024 CCAP Implementation Report.
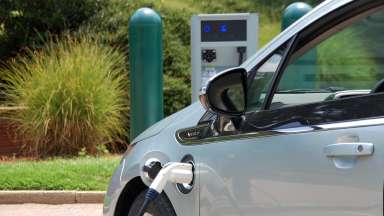
Electric Vehicles
EV’s are a cleaner option than driving a standard gas-powered vehicle, as they produce no tailpipe emissions.
The chart below shows hybrid and electric vehicle data for Wake County (Source: North Carolina Department of Transportation). You can interact with the visual by clicking on specific years, or by hovering over the bar columns to see specific data.
- Electric vehicle ownership in Wake County increased tenfold from 2018 to 2023.
- The total number of “clean” vehicle registrations (hybrid, plug-in hybrid, and electric) has more than doubled since 2018.
- Clean vehicle types represent more than 7% of the total vehicles in Wake County in 2023.
- EV manufacturing and sales are expected to grow at a rapid pace in the coming years.
- Through the City's EV Implementation Strategy Rollout, the City will work to transition its fleet to 100% electric in the next 10 years.
- 85% of the city fleet currently runs on clean alternative fuels.
EV charging stations or supply equipment, also known as “EVSE”, have also seen similar trends. EV charging expansion is needed to support the continued growth of electric vehicles.
- Level 2 chargers, often seen at office and commercial centers, have tripled since 2018.
- DC Fast chargers, more commonly seen along major transit corridors, have seen a 300% increase in installations.
Interested in learning more about electric vehicles and clean alternative fuels? Check out our Transportation Electrification and Clean Alternative Fuels page.
For more information on transportation-related climate action in Raleigh, check out our 2024 CCAP Implementation Report.