According to the National Weather Service and the CDC, extreme heat causes the most weather-related deaths in the United States. In the South, we are used to hot summers, but we are likely to see more hot days, more heat waves, and more warm nights as the effects of climate change are increasingly felt in our region.
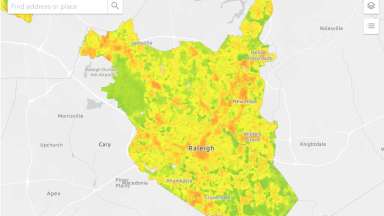
In order to better understand urban heat and how it affects the Triangle, in July 2021 over 150 community volunteers in Raleigh and Durham County spent a day collecting data for the Urban Heat Island Temperature Mapping Campaign, a citizen science project to generate maps showing the areas’ urban heat islands (UHI).
On Feb. 3 at 6.p.m, project partners will host the Raleigh/Durham HeatWatch UHI Data Release, a public webinar to introduce these maps to the community. At this webinar, representatives from the North Carolina State Climate Office, Museum of Life and Science, City of Raleigh, Durham County and CAPA strategies will present the data and discuss efforts to mitigate heat islands.
On hot days, there can be large temperature differences between different neighborhoods of a city. Factors like tree cover and amount of impervious surface can determine how different areas experience heat. The UHI Mapping project helps project partners and communities understand where heat islands are located, so that heat mitigation strategies can be identified and deployed, and residents who are most vulnerable to heat impacts can be connected to services.
This project was a part of the 2021 National Integrated Heat Health Information System (NIHHIS) and Climate Adaptation Planning Analytics (CAPA) HeatWatch Campaign. Raleigh and Durham were among 13 locations around the country selected to participate. The local project partners were the City of Raleigh, Durham County, the NC Museum of Natural Sciences, Museum of Life and Science, Activate Good, NC State Climate Office, NOAA, the National Weather Service, and CAPA Strategies. The data collected through this project was analyzed by CAPA Strategies in Portland, OR, which developed the maps.