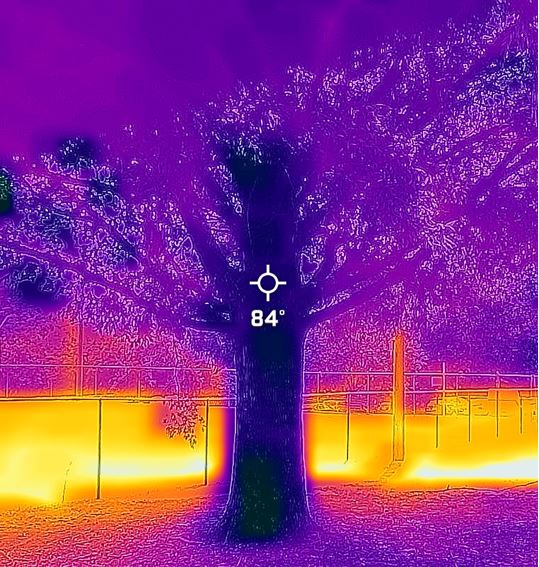
On hot days, some places feel hotter than others. To get a sense of this, imagine how you would feel on a very hot day standing in the middle of a large parking lot or on the same day how you would feel standing under a bunch of shady trees in a park.
On the hottest days in cities, people living in areas with few trees, little green space, or lots of paved surfaces can experience up to a 20 degree difference in temperature from communities in shadier, less paved areas. These hotter zones are known as Urban Heat Islands (UHI). These neighborhoods are more exposed to extreme and sometimes dangerous heat. Heat exposure can have serious health consequences and it can be more expensive to cool homes in UHI. As we continue to experience the impacts of climate change, we will have more hot days and longer heat waves.
In July of 2021, the City of Raleigh partnered with NOAA, the National Weather Service, the NC Museum of Natural Sciences, the Museum of Life and Science, Durham County, and Activate Good on a citizen science project to collect data needed to create maps of Raleigh’s urban heat islands. Community volunteers used heat sensors mounted on cars and bicycles or carried in their pockets and traveled throughout Raleigh to collect data, which was then compiled into a map by NOAA and CAPA Strategies to show where our heat islands are. Data was collected in the early morning, mid-afternoon, and early evening to understand how temperatures shift during the day and where and when heat is felt most strongly. CAPA Strategies used computer modeling to turn the data into these maps.
Select the layer icon in the upper right corner of the map below to view the morning, afternoon, or evening maps. Be sure to select only one layer at a time to read these maps correctly.
In these maps you can see cooler and warmer areas of the city. Green and yellow areas on this map are cooler than red areas, and as you view the different maps you can see how our heat islands look over the course of the day. The maps show relative temperatures so please use the legend to see temperature ranges for each map. The video below, featuring Myleigh Neill from the North Carolina State Climate Office, explains these maps in detail.
Raleigh and Durham HeatWatch Data Release Webinar
In this video from 13:00 to 30:44, Myleigh Neill from the NC State Climate Office introduces Raleigh and Durham's urban heat island maps and explains the data. After Myleigh's presentation, Megan Anderson and Tobin Fried discuss the applications of this data for Raleigh and Durham County governments.
This data will help the City and our community members prepare for and respond to extreme heat. These maps show us where people and properties are exposed to extreme heat. It’s important to remember that across our city, some people will be more sensitive to the effects of heat than others. People with health conditions like heart disease may be especially vulnerable to the impacts of extreme heat. Also, the very young and the elderly could be less able to manage heat stress. Dealing with the impacts of heat can be expensive. People who cannot afford to cool their homes, or who live in homes that are not well insulated can be very vulnerable to the impacts of heat stress. When people in these categories live in UHI they can experience dangerous health impacts.
Find out how to protect yourself from extreme heat and what the City of Raleigh is doing to protect residents.
You can stay up-to-date on heat health information at the NC Department of Heath and Human Services website.