The Raleigh Fire Department uses fire statistics to guide our efforts to keep the community safe. Statistics can show geographical areas that have a specific public safety need, for instance, and they help us keep track of resources that are needed to mitigate hazards.
Thanks to statistics, we know to focus our fire and life safety education efforts on the areas of the City that show a need at any given time. By maintaining an up-to-date set of statistics, we can carry out the services we provide at the most efficient and effective ways possible. This allows us to continue to be a safer place to live, work, play and visit for all.
2021 Stats
The year 2021 was not atypical as it relates to causes of fire in the City of Raleigh. Our top two fire causes in buildings continued to be unattended cooking and improperly discarded smoking materials. The fire department continues to concentrate fire education efforts on these key topics to reduce death, injury, and property loss in Raleigh.
Please check out the table below and the related heat maps.
Fire Incident Reports
| TYPE | TOTAL FOR 2021 | TOTAL FOR Q4 2021 |
|---|---|---|
| Cooking Fires | 215 fires (46% of all fires in buildings) | 44 (42% of all fires in buildings) |
| Smoking Materials Fire | 53 fires (11% of all fires in buildings) | 6 (6% of all fires in buildings) |
| Approximate Dollar Loss Due to Fire | $12 million | $3.6 million |
| Fire Extinguished by a Sprinkler System | 39 fires (~60% of commercial building fires)* | 10 fires (48% of commercial building fires)* |
| Fire Department EMS Responses | 28,514 | 7,399 |
| All Fires (brush, vehicle, cooking, etc.) | 1,178 (393 residential fires, 71 commercial fires) | 308 (85 residential fires, 21 commercial fires) |
*Note: Not all commercial buildings have sprinkler systems installed and some fires are simply too small to activate the sprinkler system. This tends to lower the percentage of fires extinguished compared to the number of fires occurring. There was only one occurrence in 2021 where a sprinkler system activated and was ineffective.
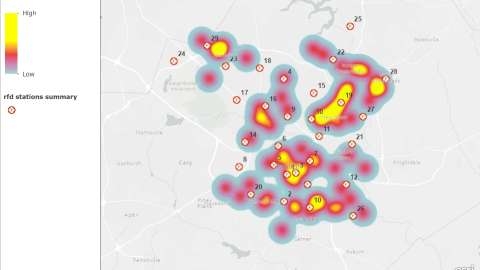
Red and yellow areas of the map show where there were a higher number of building fires in Raleigh in 2021.
Q4 2021 Stats
The final quarter of 2021 was not unusual related to the trends the Raleigh Fire Department normally sees in the fire causes that time of year. Outdoor conditions tend to become cooler and moister during the period and that cuts down on outside fires. Also, cooking and heating equipment fire occurrences tend to rise due to cold weather and the holiday season, said Chief Fire Investigator James Pearce.
It appears that the last quarter of 2021 also saw an increase in incendiary fires, although the rise is difficult to quantify. “Those fires can be some of the most dangerous fire events due to the malicious intentions of those who start them,” Pearce said. “We take incendiary fires very seriously and actively work with our counterparts in the Raleigh Police Department to prevent and prosecute those responsible for them.”
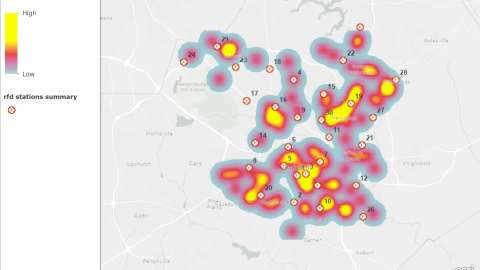
Red and yellow areas of the map show where there were a higher number of building fires in Raleigh during Q4 of 2021.